-
Notifications
You must be signed in to change notification settings - Fork 27k
New issue
Have a question about this project? Sign up for a free GitHub account to open an issue and contact its maintainers and the community.
By clicking “Sign up for GitHub”, you agree to our terms of service and privacy statement. We’ll occasionally send you account related emails.
Already on GitHub? Sign in to your account
[NEXT-1314] High memory usage in deployed Next.js project #49929
Comments
|
Is this related to Server Actions, have you isolated the case? |
|
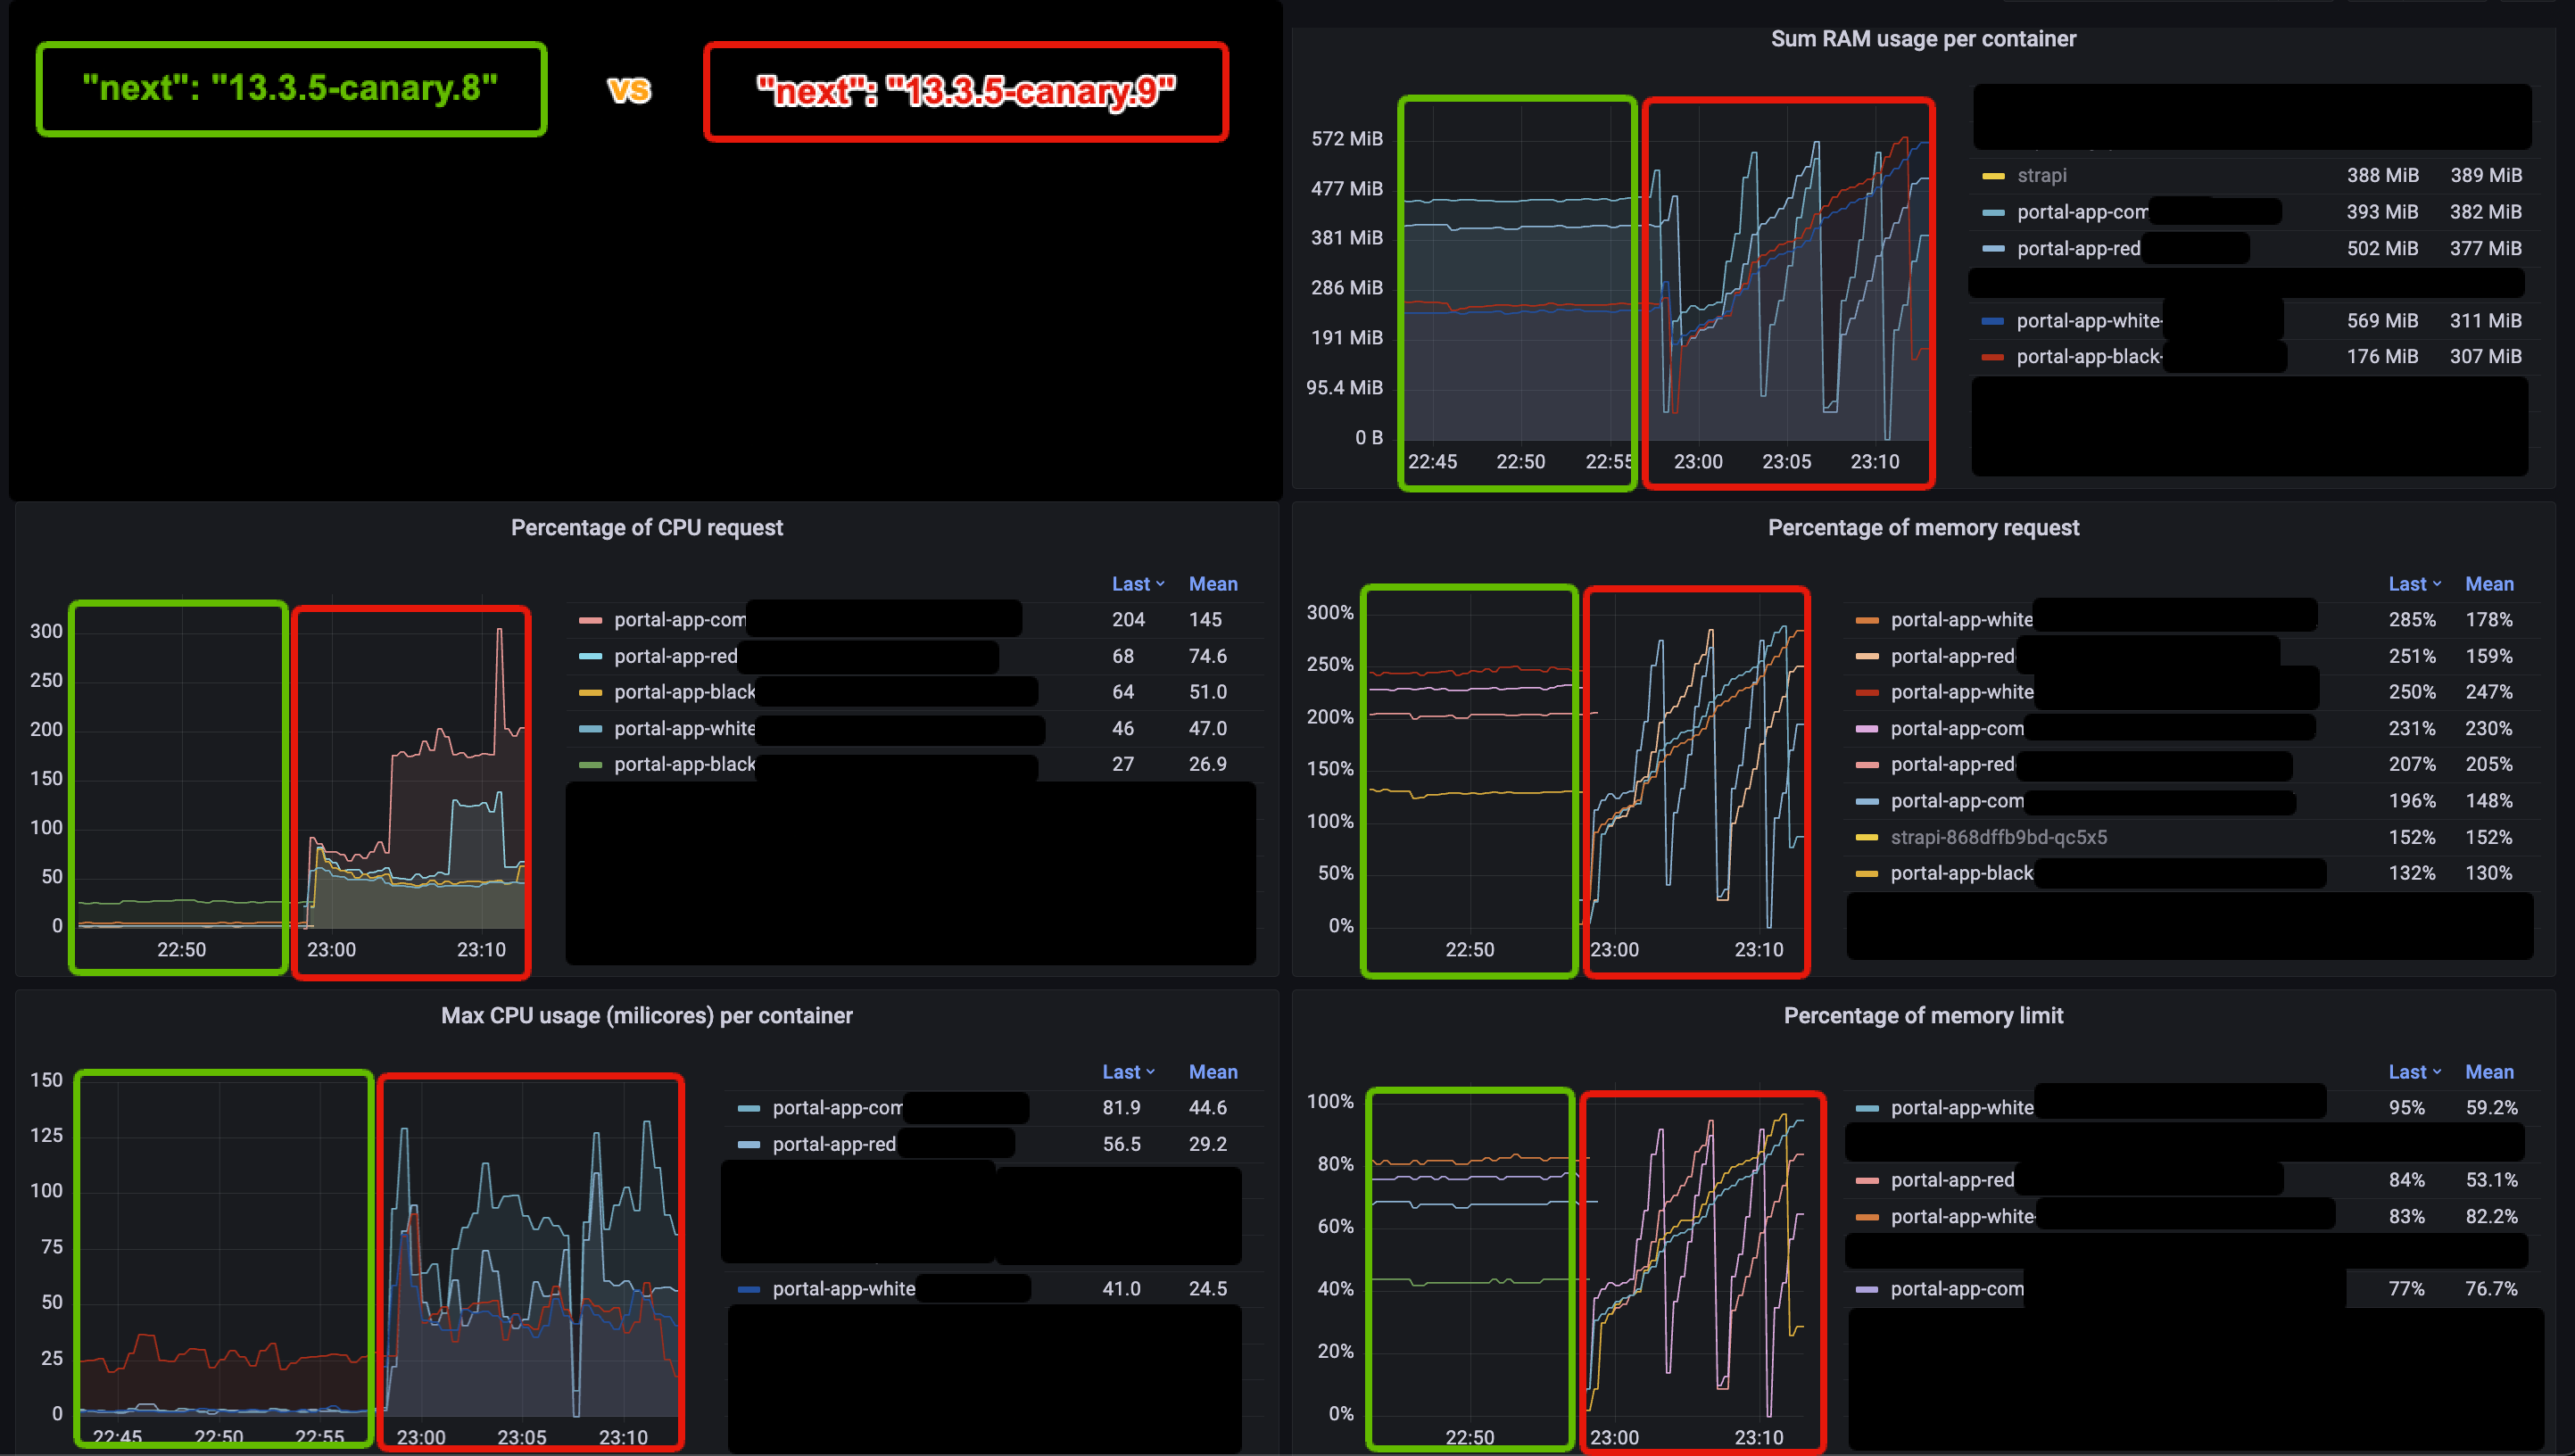
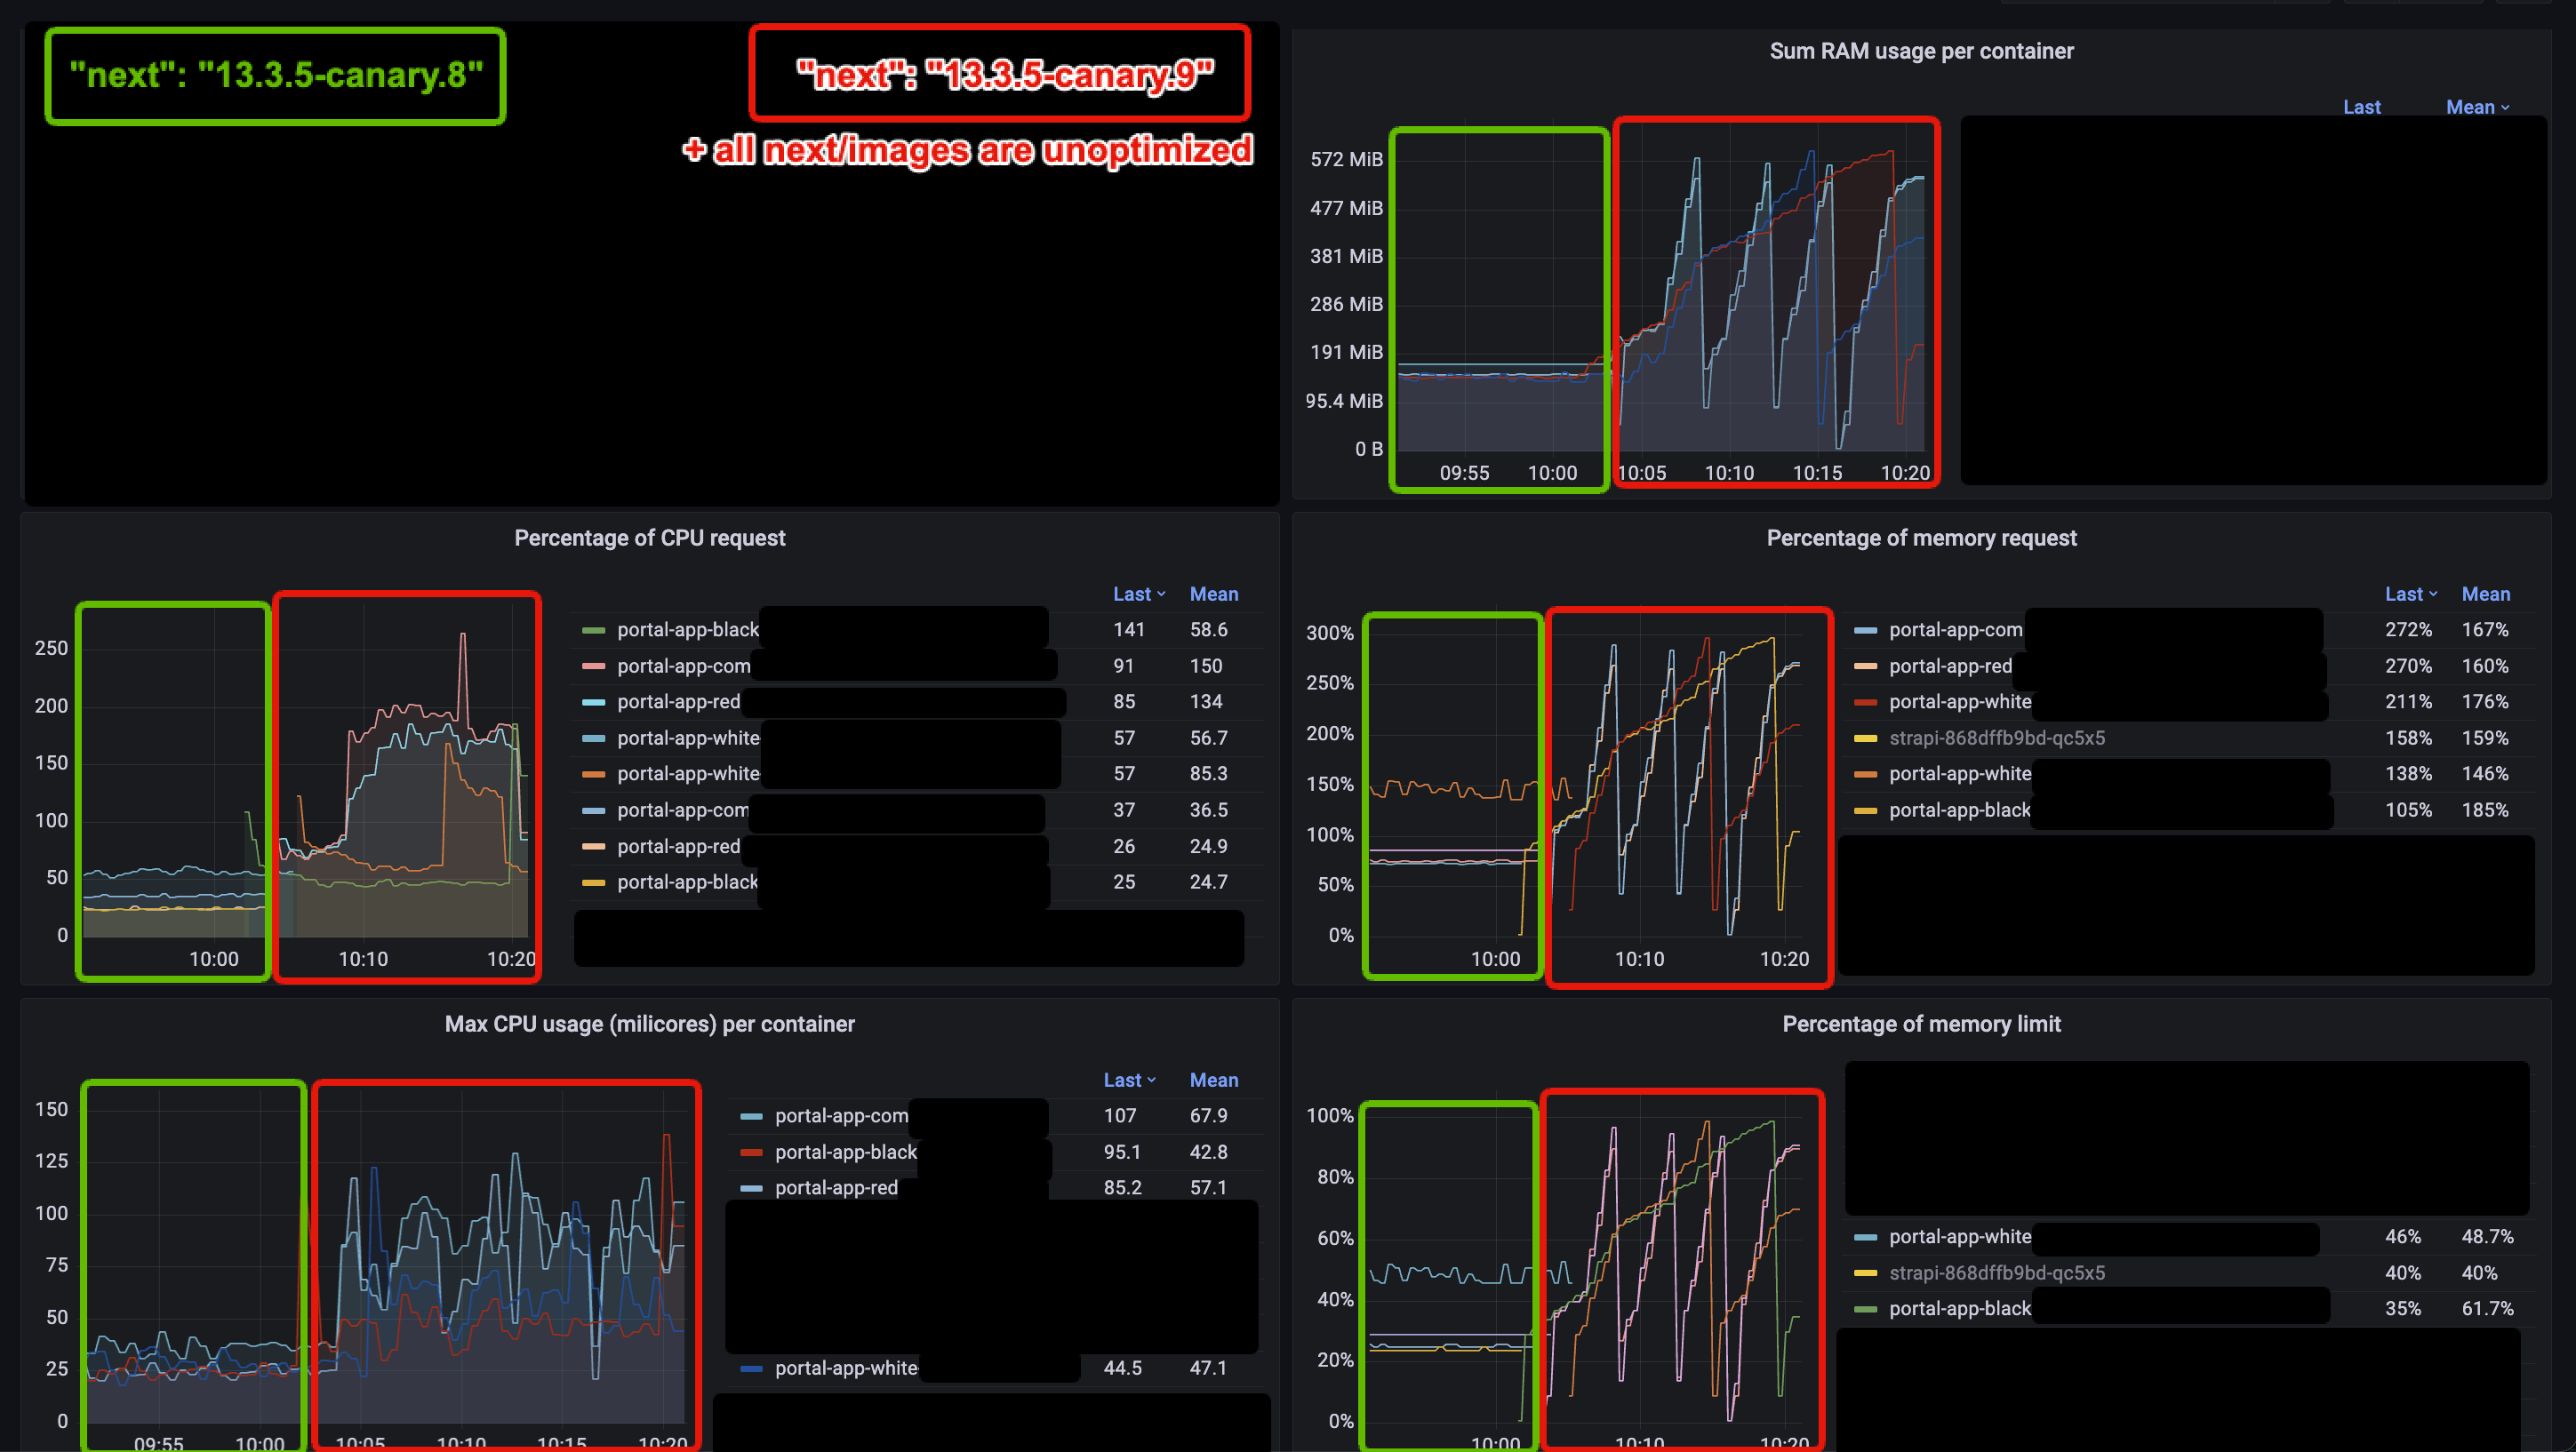
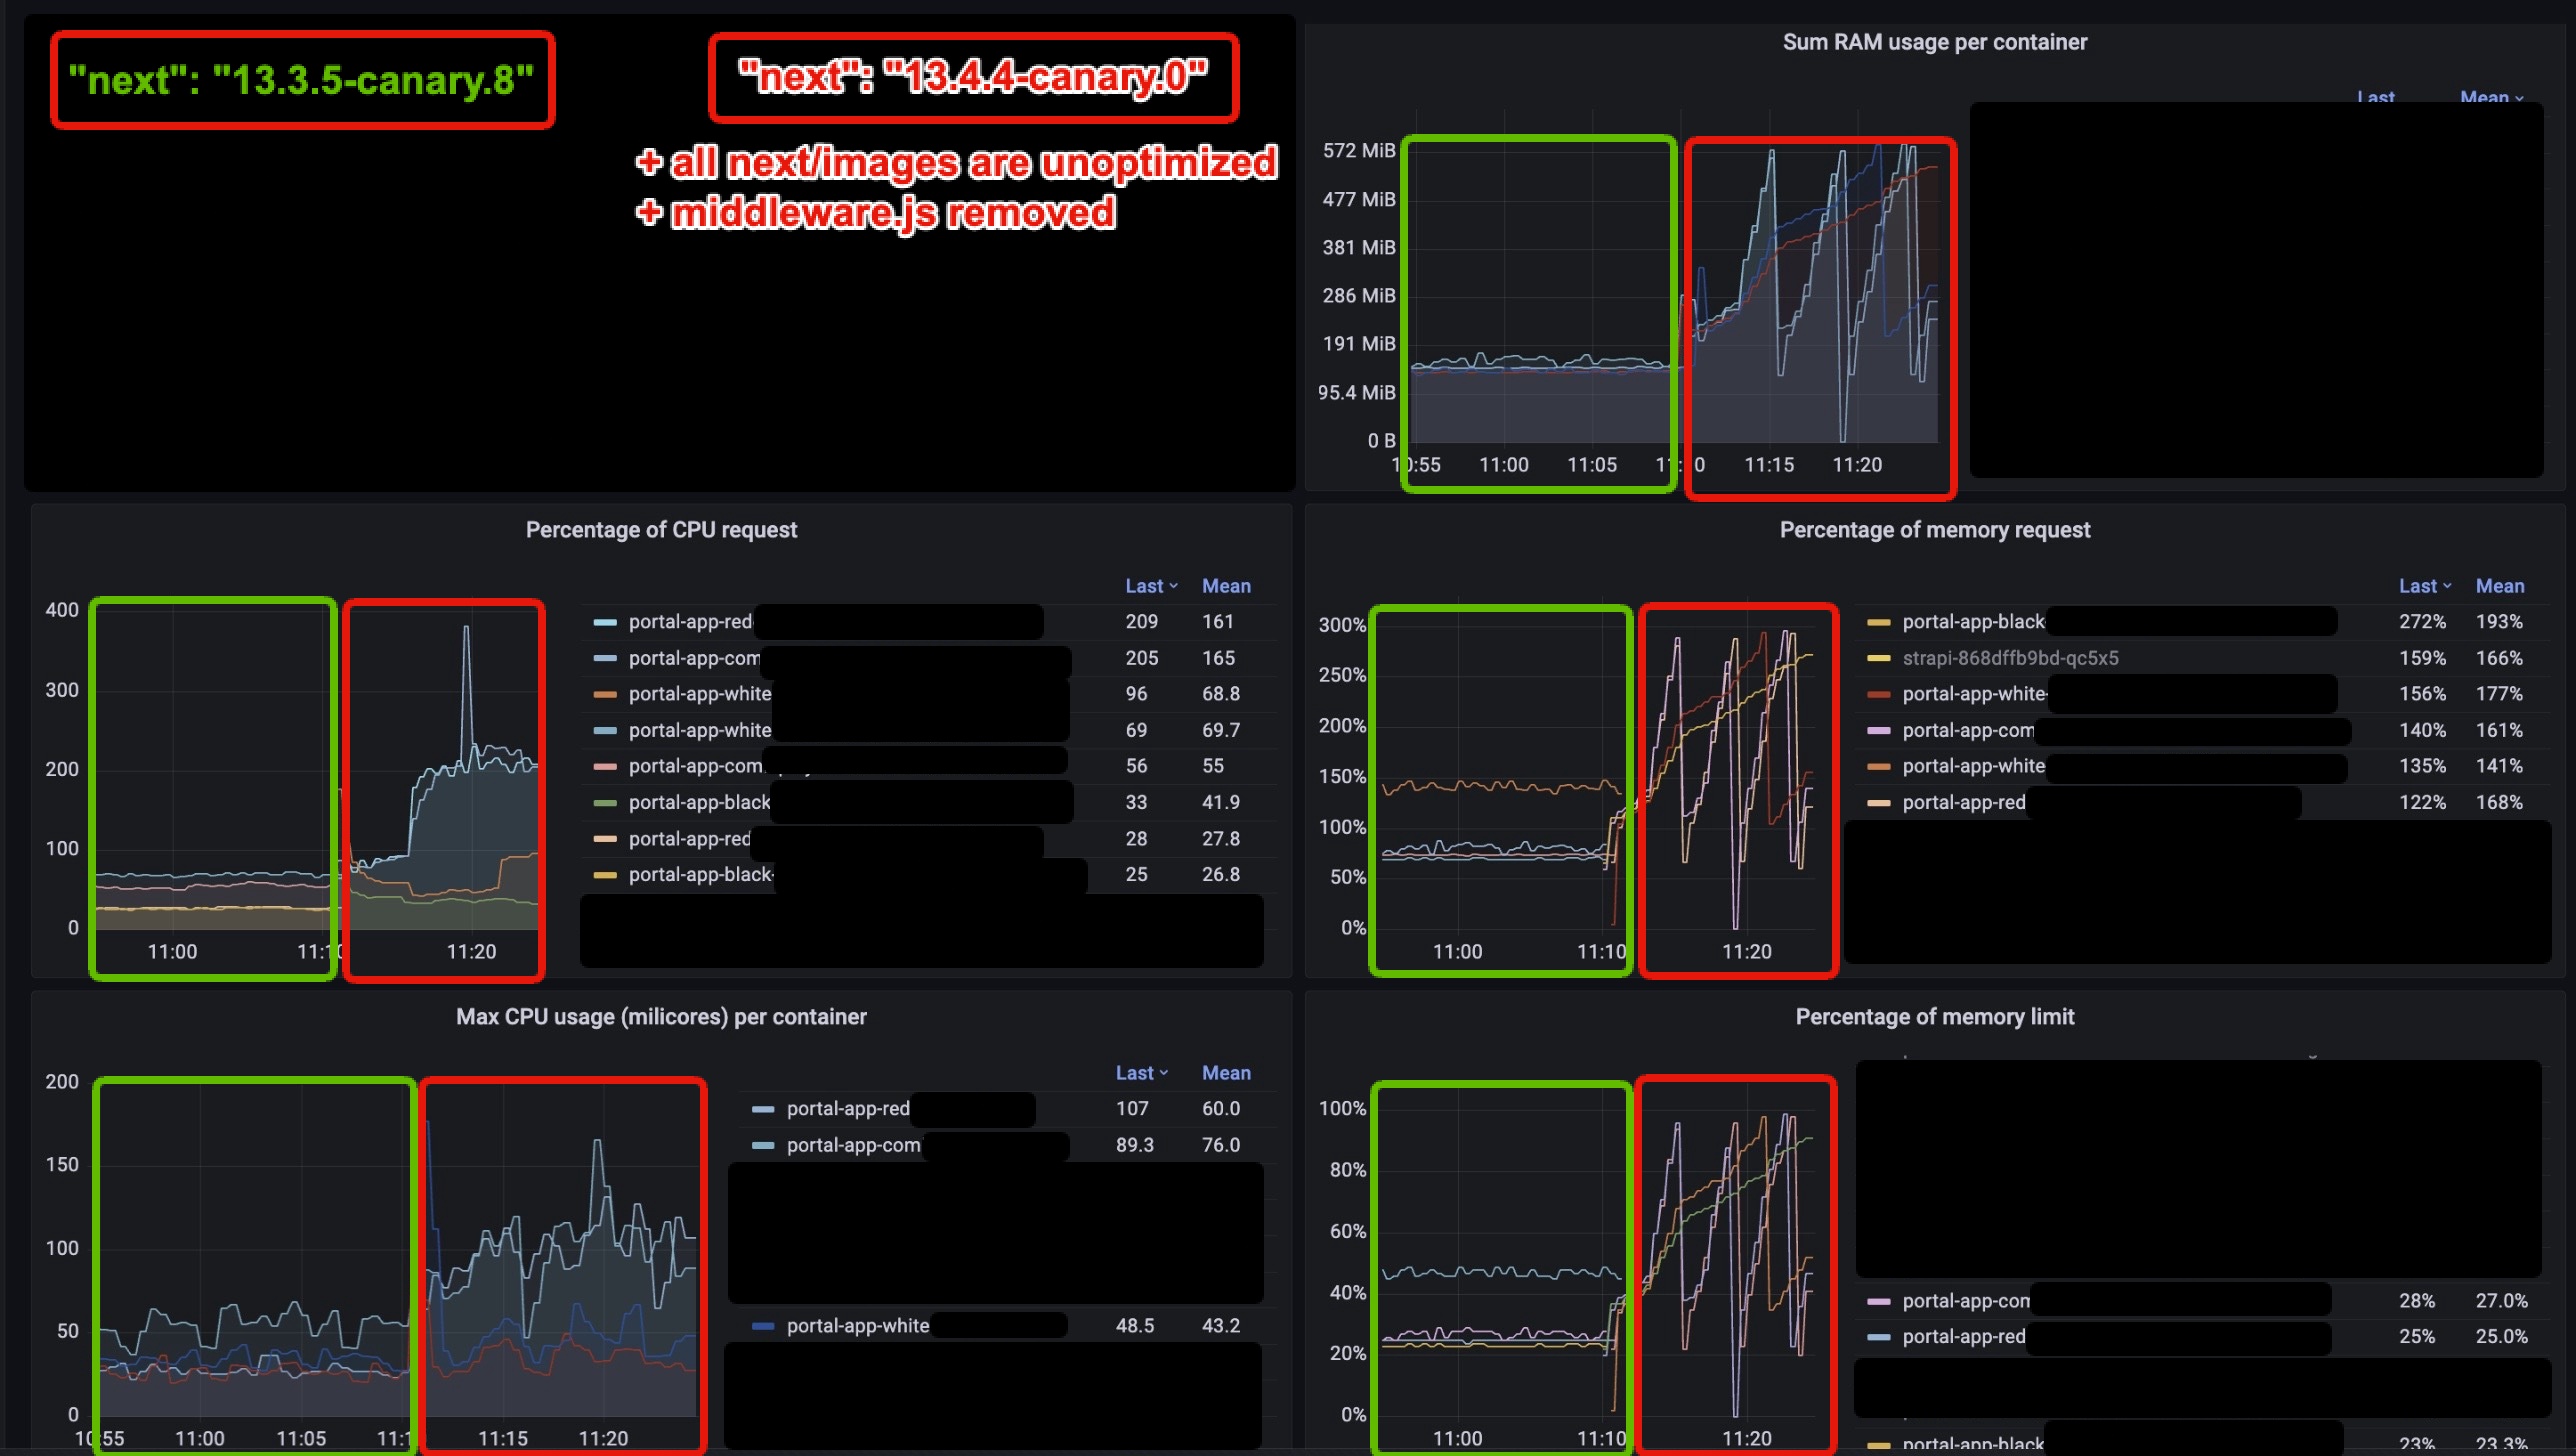
@thexpand This is not related to Server Actions. It is a severe memory leak starting from v13.3.5-canary.9. I was going to open a bug but found this one. @shuding I suspect your PR #49116 as others in mentioned canary are not likely to cause this. Can you please take a look? This blocks us from upgrading to the latest Next.js. Tech Stack:
Proofs:13.3.5-canary.8 vs 13.3.5-canary.913.3.5-canary.8 vs 13.3.5-canary.9 with all images unoptimized13.3.5-canary.8 vs 13.4.4-canary.0 (to test latest canary) with all images unoptimized + middleware removedSo, as you can see, the leak comes not from P.S. I also checked |
This comment was marked as resolved.
This comment was marked as resolved.
|
I created this reproduction repo using the latest canary version of Next.js for the error documented before. In the repo i am using i documented this in a new issue since seems a different error #50909 |
|
I created a different reproduction repo using the latest canary version of Next.js. The error is crashing the dev server when an import is missing. https://nextjs.org/docs/messages/module-not-found
<--- Last few GCs --->
[2218:0x5eb9a70] 40167 ms: Mark-sweep 252.1 (263.9) -> 250.1 (263.7) MB, 206.0 / 0.0 ms (average mu = 0.174, current mu = 0.125) allocation failure scavenge might not succeed
[2218:0x5eb9a70] 40404 ms: Mark-sweep 252.4 (263.9) -> 250.6 (264.2) MB, 216.7 / 0.0 ms (average mu = 0.135, current mu = 0.086) allocation failure scavenge might not succeed
<--- JS stacktrace --->
FATAL ERROR: Ineffective mark-compacts near heap limit Allocation failed - JavaScript heap out of memory
1: 0xb02930 node::Abort() [/usr/local/bin/node]
2: 0xa18149 node::FatalError(char const*, char const*) [/usr/local/bin/node]
3: 0xcdd16e v8::Utils::ReportOOMFailure(v8::internal::Isolate*, char const*, bool) [/usr/local/bin/node]
4: 0xcdd4e7 v8::internal::V8::FatalProcessOutOfMemory(v8::internal::Isolate*, char const*, bool) [/usr/local/bin/node]
5: 0xe94b55 [/usr/local/bin/node]
6: 0xe95636 [/usr/local/bin/node]
7: 0xea3b5e [/usr/local/bin/node]
8: 0xea45a0 v8::internal::Heap::CollectGarbage(v8::internal::AllocationSpace, v8::internal::GarbageCollectionReason, v8::GCCallbackFlags) [/usr/local/bin/node]
9: 0xea751e v8::internal::Heap::AllocateRawWithRetryOrFailSlowPath(int, v8::internal::AllocationType, v8::internal::AllocationOrigin, v8::internal::AllocationAlignment) [/usr/local/bin/node]
10: 0xe68a5a v8::internal::Factory::NewFillerObject(int, bool, v8::internal::AllocationType, v8::internal::AllocationOrigin) [/usr/local/bin/node]
11: 0x11e17c6 v8::internal::Runtime_AllocateInYoungGeneration(int, unsigned long*, v8::internal::Isolate*) [/usr/local/bin/node]
12: 0x15d5439 [/usr/local/bin/node]I documented this in a new issue since it seems a different error #51025 |
|
I created a reproduction using Docker to showcase how a Simple project using Next.js crashes when being used in environtments with ~225MB. Steps to reproduce:
The way I recreated this Reproduction was by creating a Docker image from a simple Next.js app using autocannon to fake traffic to the website from a button.
|
|
Is this related to #49677 maybe? |
|
@Starefossen thanx! I've read that issue and found one connection with my setup: #49677 (comment) I also run my Next.js with I will try to find time and repeat my upgrade without this option or some other change related to this. I can see that it already fixes the problem for this developer. |
|
+1 happening the same on our systems , no dev in my team with 8Gigs of ram is able to work with it, this is also happening specifically when we are using app router , its kind of painful to switch to different routing definition back and forth. next version 13.4.4 |
|
Usage graph running on railway. June 15th image optimization was disabled. Also cache rate drastically increase — may be related. Not sure how much of an issue this is in serverless land since processes don't run long enough to have memory leaks. Similar: #44685 |
|
+1 same situation can be seen in our deployed next js app :/ |
|
Same issue here, running on Next.js 13.4.6 deployed on Fly.io. I worked around the problem by allocating 2048 MiB of memory to the instance and a 512 MiB swap as a buffer. As you can see, I'm only delaying the inevitable OOM, but this at least makes the issue much less frequent. You can find the source code here: https://github.com/hampuskraft/arewepomeloyet.com. |
|
Tried the newest Here's another example of a pod that has min: 1 - max: 2 replica, where the green has been alive for a while, where the yellow came up and initially used 300MB, then as soon as a single request hit it it jumped to 520MB. This app isn't using a single Here's the same app in production that's actually getting a few thousand visits: |
|
Try uninstalling |
|
I already uninstalled sharp and disabled image optimization, it didn't help in my case. |
|
Not sure if this is next's supported solution, so YMMV, but only thing that helped us on 13.4.4+ was to set: That disables the new appdir support which became the default in 13.4, but also turns off the extra workers. It also fixed the leaked socket issue calling crashes/timeout issue (#51560 ), which appears related - the extra processes (see #45508 for build, but also next start) are leaking as far as I can tell, causing everyone's memory issues. Might not be exact cause, but highly correlated for sure. |
|
@hampuskraft I should say -our site is using |
This comment was marked as off-topic.
This comment was marked as off-topic.
This comment was marked as off-topic.
This comment was marked as off-topic.
This comment was marked as off-topic.
This comment was marked as off-topic.
This comment was marked as outdated.
This comment was marked as outdated.
This comment was marked as off-topic.
This comment was marked as off-topic.
This comment was marked as off-topic.
This comment was marked as off-topic.
This comment was marked as off-topic.
This comment was marked as off-topic.
|
@tghpereira again, please read my earlier posts...
|
This should fix the memleak issue we are seeing See vercel/next.js#49929
This should fix the memleak issue we are seeing See vercel/next.js#49929
This should fix the memleak issue we are seeing See vercel/next.js#49929
This should fix the memleak issue we are seeing See vercel/next.js#49929
|
Hey everyone,
It's out on We've also made a change to the implementation using Sharp to reduce the amount of concurrency it handles (usually it would take all cpus). That should help a bit with peak memory usage when using Image Optimization. I'd like to get a reproduction for the Image Optimization causing high memory usage so that it can be investigated in a new issue so if someone has that please provide it. With these changes landed I think it's time to close this issue as these changes cover the majority of comments posted. We can post a new issue specifically tracking memory usage with image optimization. There is a separate issue for development memory usage already. |
|
Thanks Tim, I upgraded the original projects @ProchaLu mentioned in the OP (the ones deployed on the free Fly.io machines with 256MB RAM) to |
|
cc Fly.io folks @michaeldwan @rubys @jeromegn @dangra @mrkurt so that you're aware that deploying Next.js apps with App Router can lead to OOM (Out of Memory) errors on Fly.io with the free tier ("Free allowances") with 256MB RAM - in case this would represent a business reason for Fly.io to upgrade the base free allowance RAM to 512MB As mentioned in my last message above, we have now upgraded to the latest Next.js version, and I have yet to see a crash on Fly.io because of OOM errors, but in case the issue persists after some time, you may also hear this from other customers in the future. |
|
@karlhorky thanks for letting us know. FTR: for the case of apps running on 256MB machines, adding swap memory usually helps https://fly.io/docs/reference/configuration/#swap_size_mb-option |
|
Thanks for the extra tip about the swap memory - we also tried that as well, after getting that tip in the community post |
|
@karlhorky all good, the only nuance is that that post describes how to setup swap space manually. While the link I shared only requires adding a |
|
Going to close this issue as mentioned yesterday as all changes / investigation has been landed and there haven't been new reports since shipping my changes earlier. Keep in mind that Node.js below 18.17.0 has a memory leak in I've opened a separate issue about the Image Optimization memory usage, we'll need a reproduction there, if it's not provided the issue will auto-close so please provide one, thank you! Link: #54482. Thanks to everyone that provided a reproduction that we could actually investigate. |


Verify canary release
Provide environment information
Operating System:
      Platform: darwin
      Arch: arm64
      Version: Darwin Kernel Version 22.1.0: Sun Oct  9 20:14:30 PDT 2022; root:xnu-8792.41.9~2/RELEASE_ARM64_T8103
    Binaries:
      Node: 18.15.0
      npm: 9.5.0
      Yarn: 1.22.19
      pnpm: 8.5.0
    Relevant packages:
      next: 13.4.3-canary.1
      eslint-config-next: N/A
      react: 18.2.0
      react-dom: 18.2.0
      typescript: 5.0.4
Which area(s) of Next.js are affected? (leave empty if unsure)
No response
Link to the code that reproduces this issue
https://codesandbox.io/p/github/ProchaLu/next-js-ram-example/
To Reproduce
Describe the Bug
I have been working on a small project to reproduce an issue related to memory usage in Next.js. The project is built using the Next.js canary version
13.4.3-canary.1. It utilizes Next.js with App Router and Server Actions and does not use a database.The problem arises when deploying the project on different platforms and observing the memory usage behavior. I have deployed the project on multiple platforms for testing purposes, including Vercel and Fly.io.
On Vercel: https://next-js-ram-example.vercel.app/
When interacting with the deployed version on Vercel, the project responds as expected. The memory usage remains stable and does not show any significant increase or latency
On Fly.io: https://memory-test.fly.dev/
However, when deploying the project on Fly.io, I noticed that the memory usage constantly remains around 220 MB, even during normal usage scenarios
Expected Behavior
I expect the small project to run smoothly without encountering any memory-related issues when deployed on various platforms, including Fly.io. Considering the previous successful deployment on Fly.io, which involved additional resource usage and utilized Next.js 13 with App Router and Server Actions, my anticipation is that the memory usage will remain stable and within acceptable limits.
Fly.io discussion: https://community.fly.io/t/high-memory-usage-in-deployed-next-js-project/12954?u=upleveled
Which browser are you using? (if relevant)
Chrome
How are you deploying your application? (if relevant)
Vercel, fly.io
NEXT-1314
The text was updated successfully, but these errors were encountered: